Reflections in spheres
The beautiful images that can be produced by raytracing reflection in spheres.
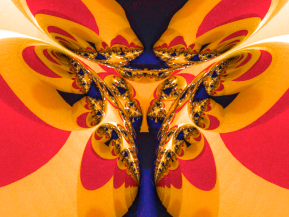
The beautiful images that can be produced by raytracing reflection in spheres.
Some thoughts on spirographs and how to make them in three dimensions.
As promised here is a draft of my article on ideas for the LMS and using the internet for society communication. Please comment! Currently the LMS has two main mean of communication. The… Continue reading
